Website owner: James Miller
Regression. Regression curve. Linear correlation. Standard error of estimate. Explained and unexplained variation. Coefficient of determination. Coefficient of correlation. Product-Moment formula.
Regression. Often, on the basis of sample data, we wish to estimate the value of a variable Y corresponding to a given value of a variable X. This can be accomplished by estimating the value of Y from a least square curve which fits the sample data. The estimating curve is called a regression curve of Y on X, since Y is estimated from X.
If we desired to estimate the value of X from a given value of Y we would use a regression curve of X on Y, which amounts to interchanging the variables in the scatter diagram so that X is the dependent variable and Y is the independent variable. This is equivalent to replacing vertical deviations in the definition of least square by horizontal deviations.
In general the regression line or curve of Y on X is not the same as the regression line or curve of X on Y.
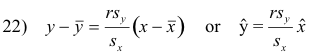
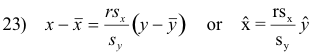
Table 1 shows the heights to the nearest inch and weights to the nearest pound of a sample of male students drawn at random from the first year students at Chandler College. Fig. 1 shows the regression line of Y on X
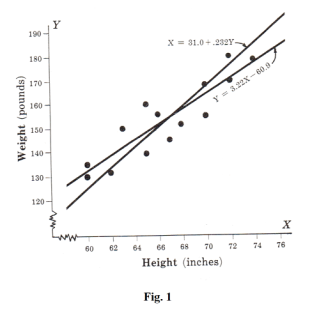
1) Y = 3.22 X - 60.9
and the regression line of X on Y
2) X = 31.0 + .232 Y
which are simply the least square lines of Y versus X and X versus Y for the data.
Problem 1. 1. Estimate the weight of a student whose height is known to be 63 inches.
Solution. Using the regression line of Y on X we compute his height as Y = 3.22 X - 60.9 = 3.22 (63) - 60.9 = 142 pounds.
Problem 2. Estimate the height of a student whose weight is known to be 168 pounds.
Solution. Using the regression line of X on Y we compute his height as X = 31.0 + .232 Y = 31.0 + .232(168) = 70.0 inches.
Correlation. If all values of the variables satisfy aa equation exactly we say that the variables are perfectly correlated or that there is perfect correlation between them. Thus the circumferences C and radii r of all circles are perfectly correlated since C = 2πr. If two dice are tossed simultaneously 100 times there is no relationship between corresponding points on each die (unless the dice are loaded), i.e. they are uncorrelated. The variables height and weight of individuals show some correlation.
When only two variables are involved we speak of simple correlation and simple regression. When more than two variables are involved we speak of multiple correlation and multiple regression.
Linear correlation. If X and Y denote two variables under consideration, a scatter diagram shows the location of points (X, Y) on a rectangular coordinate system. If all points in this scatter diagram seem to lie near a line, as in (a) and (b) of Fig. 2, the correlation is called linear.
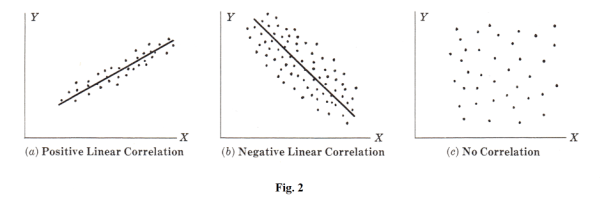
If Y tends to increase as X increases, as in (a), the correlation is called positive or direct correlation. If Y tends to decrease as X increases, as in (b), the correlation is called negative or inverse correlation.
If all points seem to lie near some curve, the correlation is called non-linear and a non-linear equation is appropriate for regression or estimation. Obviously non-linear correlation can sometimes be positive and sometimes negative.
If there is no relationship indicated between the variables, as in Fig. 2 (c), we say there is no correlation between them, i.e. they are uncorrelated.
Measures of correlation. One can determine how well a given line or curve describes the relationship between variables in a qualitative manner by looking at a scatter diagram. However, to describe correlation in a quantitative manner it is necessary to devise measures of correlation.
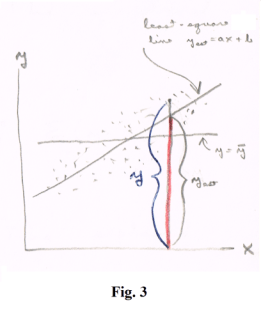
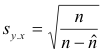
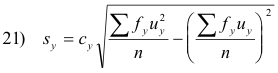
Standard error of estimate. Let yest = ax + b be the least square y on x regression line for a linear cluster of points obtained from a set of (x, y) measurements. See Fig. 3. The quantity sy.x defined by
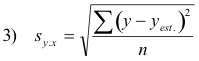
is called the standard error of estimate of y on x.
For the case of an x on y regression line the standard error of estimate is given by
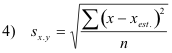
In general, sy.x ≠ sx.y.
Equation 3) can be written
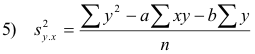
which may be more suitable for computation.
A similar expression exists for 4).
The standard error of estimate has properties analogous to those of the standard deviation. For example, if we construct lines parallel to the regression line of y on x at respective vertical distances sy.x, 2sy.x, and 3sy.x from it, we should find, if n is large enough, that there would be included between these lines about 68%, 95%, and 99.7% of the sample points.
Just as a modified standard deviation given by

was found useful for small samples, so a modified standard error of estimate given by
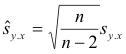
is useful. For this reason some statisticians prefer to define 3) or 4) with n-2 replacing n in the denominator.
Explained and
unexplained
variation. The
total variation of Y
is defined as
![]() i.e. the
sum of the squares
of the deviations of
the values of y from
the mean
i.e. the
sum of the squares
of the deviations of
the values of y from
the mean
![]() . This can be written
. This can be written
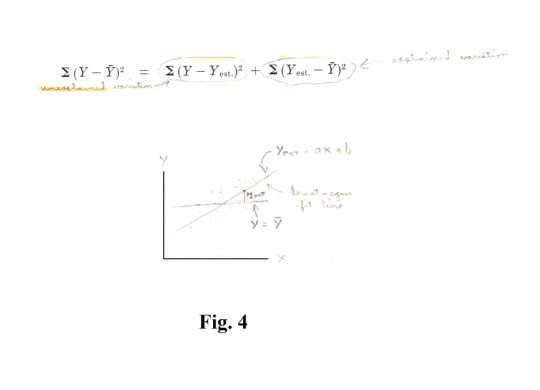
![]()
The first term on the right is called the unexplained variation and the second term is called the
explained variation, so called because the deviations
![]() have a definite pattern while the
deviations y - yest. behave in a random or unpredictable manner. See Fig. 4.
have a definite pattern while the
deviations y - yest. behave in a random or unpredictable manner. See Fig. 4.
Coefficient of determination. The coefficient of determination is the ratio of the explained variation to the total variation.
● If there is zero explained variation, i.e. the total variation is all unexplained, the coefficient of determination is zero.
● If there is zero unexplained variation, i.e. the variation is all explained, the coefficient of determination is one.
● The Coefficient of determination is always greater than or equal to 0.
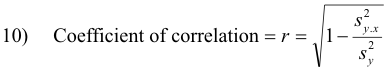
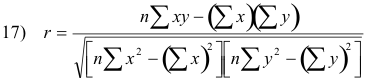
Coefficient of correlation. The coefficient of correlation, denoted by r, is given by

The signs + are used for positive linear correlation and negative linear correlation respectively.
Using 3) and 6) and the fact that the standard deviation of y is
we find that 8) can be written, disregarding sign, as
and
![]()
Similar equations exist when x and y are interchanged.
For the case of linear correlation the quantity r is the same regardless of whether x or y is considered the independent variable. Thus r is a very good measure of the linear correlation between two variables.
Remarks concerning the Correlation coefficient. The definitions 8) or 10) are quite general and can be used for non-linear relationships as well as linear, the only difference being that yest. is computed from a non-linear regression equation in place of a linear regression equation and the signs + are omitted. In such case equation 3) defining the standard error of estimate is perfectly general. Equation 5), however, which applies to linear regression only, must be modified. If, for example, the estimating equation is
12) y = a0 + a1x + a2x2 + ..... + an-1 x n-1
equation 5) is replaced by

In such case the modified standard error of estimate is
where the quantity n -
![]() is called the number of degrees of freedom.
is called the number of degrees of freedom.
It should be pointed out that a high correlation coefficient (i.e. near 1 or -1) does not necessarily indicate a direct dependence of the variables. Thus there may be a high correlation between the number of books published each year and the number of baseball games played each year. Such examples are sometimes referred to as nonsense or spurious correlations.
Product-Moment formula for the linear correlation coefficient. If a linear relationship between two variables is assumed, it can be shown that equation 8) is equivalent to
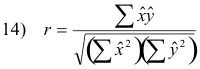
where
![]() . This formula, which automatically gives the proper sign of
r, is called the product-moment formula and clearly shows the symmetry between x and y.
. This formula, which automatically gives the proper sign of
r, is called the product-moment formula and clearly shows the symmetry between x and y.
If we write
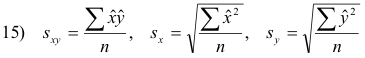
then sx and sy will be recognized as the standard deviations of the variables x and y respectively,
while
![]() and
and
![]() are their variances. The new quantity sxy is called the covariance of x and y. In
terms of the symbols of 15), 14) can be written
are their variances. The new quantity sxy is called the covariance of x and y. In
terms of the symbols of 15), 14) can be written
Note that r is not only independent of the choice of units of x and y but is also independent of the choice of origin.
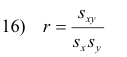
Short computational formulas. Formula 14) can be written in the equivalent form
which is often used for computing r.
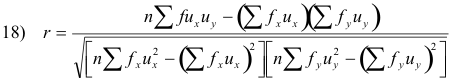
For data grouped as in a bivariate frequency table or bivariate frequency distribution it is convenient to use a coding method. In this case 17) can be written
For grouped data, formulas 15) can be written
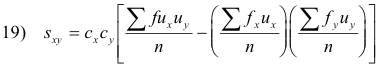
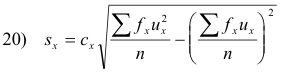
where cx and cy are the class interval widths (assumed constant) corresponding to the variables x and y respectively.
Regression Lines and the Linear Correlation Coefficient. The equation of the least square line y = ax + b, or regression line of y on x, can be written as
Similarly the regression line of x on y, x = cy + d, can be written
The slopes of lines 22) and 23) are equal if and only if r = +1. In such case the two lines are identical and there is perfect correlation between the variables x and y. If r = 0 the lines are at right angles and there is no linear correlation between x and y. Thus the correlation coefficient measures the departure of the two regression lines.
Note that if the equations 22) and 23) are written y = ax + b and x = cy + d respectively, then ac = r2.
Portions excerpted from Murray R. Spiegel. Statistics. Schaum.
References
Murray R Spiegel. Statistics (Schaum Publishing Co.)
Jesus Christ and His Teachings
Way of enlightenment, wisdom, and understanding
America, a corrupt, depraved, shameless country
On integrity and the lack of it
The test of a person's Christianity is what he is
Ninety five percent of the problems that most people have come from personal foolishness
Liberalism, socialism and the modern welfare state
The desire to harm, a motivation for conduct
On Self-sufficient Country Living, Homesteading
Topically Arranged Proverbs, Precepts, Quotations. Common Sayings. Poor Richard's Almanac.
Theory on the Formation of Character
People are like radio tuners --- they pick out and listen to one wavelength and ignore the rest
Cause of Character Traits --- According to Aristotle
We are what we eat --- living under the discipline of a diet
Avoiding problems and trouble in life
Role of habit in formation of character
Personal attributes of the true Christian
What determines a person's character?
Love of God and love of virtue are closely united
Intellectual disparities among people and the power in good habits
Tools of Satan. Tactics and Tricks used by the Devil.
The Natural Way -- The Unnatural Way
Wisdom, Reason and Virtue are closely related
Knowledge is one thing, wisdom is another
My views on Christianity in America
The most important thing in life is understanding
We are all examples --- for good or for bad
Television --- spiritual poison
The Prime Mover that decides "What We Are"
Where do our outlooks, attitudes and values come from?
Sin is serious business. The punishment for it is real. Hell is real.
Self-imposed discipline and regimentation
Achieving happiness in life --- a matter of the right strategies
Self-control, self-restraint, self-discipline basic to so much in life