Website owner: James Miller
Curve fitting. The method of least squares.

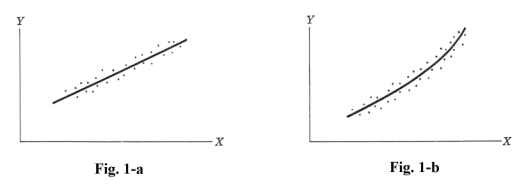
In science and engineering we are always making measurements and, for various reasons, measurements invariably contain some error. For example Fig. 1 shows the plots obtained from measurements of two different phenomena. In Fig 1-a the plotted points obviously follow a straight line. In Fig. 1-b they obviously follow a curve. Such plots of measurements are often called scatter diagrams. Exactly where does the true line or curve actually lie? How do we determine it? Well, one way is to establish the curve is to look at the scatter diagram and simply draw in the line or curve where we think it should be. But there is another way. It is done by what is called “the Method of Least Squares”. Points from measurements may follow a straight line or they follow some curve such as a parabola, hyperbola, or some other curve. To use the Method of Least Squares we must first hypothesize as to what curve they follow.
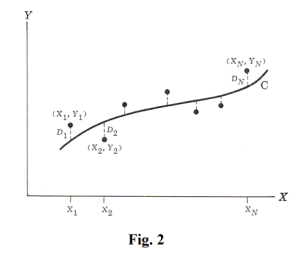
To motivate a possible technique for finding a best line or curve consider Fig. 2. Here a curve C has been postulated. For each of the discrete values x1, x2, ... , xN of x there is a vertical distance shown in the figure as D1, D2, ... , DN between the corresponding point and the curve. This distance Di is sometimes referred to as the deviation, error or residual and may be positive, negative or zero.
A measure of the “goodness of fit” of the curve C to the given data is provided by the quantity
![]()
If this is small the fit is good. If it is large, the fit is bad. We thus make the following definition
Definition. Of all curves approximating a given set of points, the curve having the property that
![]()
is called a best fitting curve.
A curve having this property is said to fit the data in the least square sense and is called a least square curve. A line having this property is called a least square line, a parabola having this property is called a least square parabola, etc.
It is customary to employ the above definition when x is the independent variable and y is the dependent variable. If y is the independent variable and x is the dependent variable we use horizontal deviations instead of vertical deviations — which will lead to different least square curves.
The least square line. The least square line approximating the set of points (x1, y1), (x2, y2), .... , (xn, yn) is given by the equation
1) y = a0 + a1x
where the constants a0 and a1 are determined by solving simultaneously the system of equations
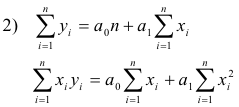
for a0 and a1. Proof. These equations, called the normal equations for the least square line, are easily remembered by observing that the first equation is obtained formally by summing on both sides of 1) i.e. Σy = Σ(a0 + a1x) and the second equation is obtained formally by first multiplying both sides of 1) by x and then summing i.e. Σxy = Σx(a0 + a1x) = a0Σx + a1Σx2.
Solution of the normal equations gives the following values for a0 and a1:
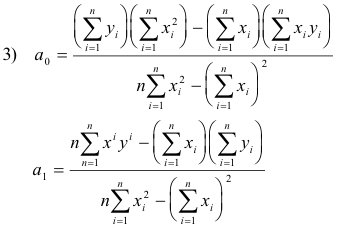
If the variable x is taken as the dependent instead of the independent variable we write 2) as x = b0 + b1y. Then the above results hold if x and y are interchanged and a0 and a1 are replaced by b0 and b1 respectively. The resulting least square line, however, will not be the same as the one obtained above.
The least square parabola. The least square parabola approximating the set of points (x1, y1), (x2, y2), .... , (xn, yn) is given by the equation
4) y = a0 + a1x + a2x2
where the constants a0, a1 and a2 are determined by solving simultaneously the system of equations
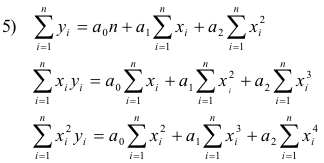
for a0, a1 and a2 . These equations, called the normal equations for the least square parabola, are easily remembered by observing that they can be obtained formally by multiplying equation 4) by 1, x, and x2 respectively and summing on both sides of the resulting equations. This technique can be extended to obtain normal equations for least square cubic curves, least square quartic curves and in general least square curves of type
y = a0 + a1x + a2x2 + ..... + anxn.
Problems involving more than two variables. Problems involving more than two variables can be treated in a manner analogous to that for two variables. For example, there may be a relationship between the three variables x, y, and z which can be described by the equation
6) z = a0 + a1x + a2y
which is called a linear equation in the variables x, y and z.
In a three dimensional rectangular coordinate system this equation represents a plane. The sample points (x1, y1, z1), (x2, y2, z2), .... , (xn, yn, zn) may be scattered in space in such a way as to suggest they approach some “approximating plane”. By extension of the method of least squares, we can speak of a least square plane approximating the data. The normal equations corresponding to the least square plane 6) are given by
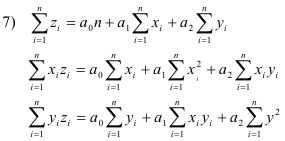
and can be remembered as obtained from 6) by multiplying by 1, x, and y successively and then summing.
References
Murray R Spiegel. Statistics (Schaum Publishing Co.)
Jesus Christ and His Teachings
Way of enlightenment, wisdom, and understanding
America, a corrupt, depraved, shameless country
On integrity and the lack of it
The test of a person's Christianity is what he is
Ninety five percent of the problems that most people have come from personal foolishness
Liberalism, socialism and the modern welfare state
The desire to harm, a motivation for conduct
On Self-sufficient Country Living, Homesteading
Topically Arranged Proverbs, Precepts, Quotations. Common Sayings. Poor Richard's Almanac.
Theory on the Formation of Character
People are like radio tuners --- they pick out and listen to one wavelength and ignore the rest
Cause of Character Traits --- According to Aristotle
We are what we eat --- living under the discipline of a diet
Avoiding problems and trouble in life
Role of habit in formation of character
Personal attributes of the true Christian
What determines a person's character?
Love of God and love of virtue are closely united
Intellectual disparities among people and the power in good habits
Tools of Satan. Tactics and Tricks used by the Devil.
The Natural Way -- The Unnatural Way
Wisdom, Reason and Virtue are closely related
Knowledge is one thing, wisdom is another
My views on Christianity in America
The most important thing in life is understanding
We are all examples --- for good or for bad
Television --- spiritual poison
The Prime Mover that decides "What We Are"
Where do our outlooks, attitudes and values come from?
Sin is serious business. The punishment for it is real. Hell is real.
Self-imposed discipline and regimentation
Achieving happiness in life --- a matter of the right strategies
Self-control, self-restraint, self-discipline basic to so much in life