Website owner: James Miller
Statistical estimation theory. Statistical inference. Sampling distribution of a statistic. Biased and unbiased estimators. Efficient and inefficient estimates. Point estimates and interval estimates. Confidence interval estimates of population parameters. Probable error.
Statistical inference. An important problem in statistics is to deduce information about a population from samples drawn from it. Conclusions are made about population parameters (such as population mean, standard deviation, etc.) from statistics (mean, standard deviation, etc.) computed for samples of the population. Population parameters, (or briefly parameters), are determined to some level of accuracy from computed sample statistics, (or briefly statistics). The process is called statistical inference.
The statistical inference process utilizes the concept of the sampling distribution of a statistic (such as sampling distribution of the mean, standard deviation, etc) from sampling theory. See Elementary sampling theory. Sampling distribution of a statistic. Sampling distribution of means, standard deviations, proportions, differences and sums.
Def. Sampling distribution of a statistic. Consider all possible samples of size n that can be drawn from a given population (either with or without replacement). For each sample we can compute a statistic, such as the mean, standard deviation, etc. We thus obtain a distribution of the statistic which is called its sampling distribution.
Example. Consider a normal population with a mean μ and variance σ2. Assume we repeatedly
take samples of a given size from this population and calculate the arithmetic mean
![]() for each
sample — this statistic is called the sample mean. The distribution of these means is called the
“sampling distribution of the sample mean”.
for each
sample — this statistic is called the sample mean. The distribution of these means is called the
“sampling distribution of the sample mean”.
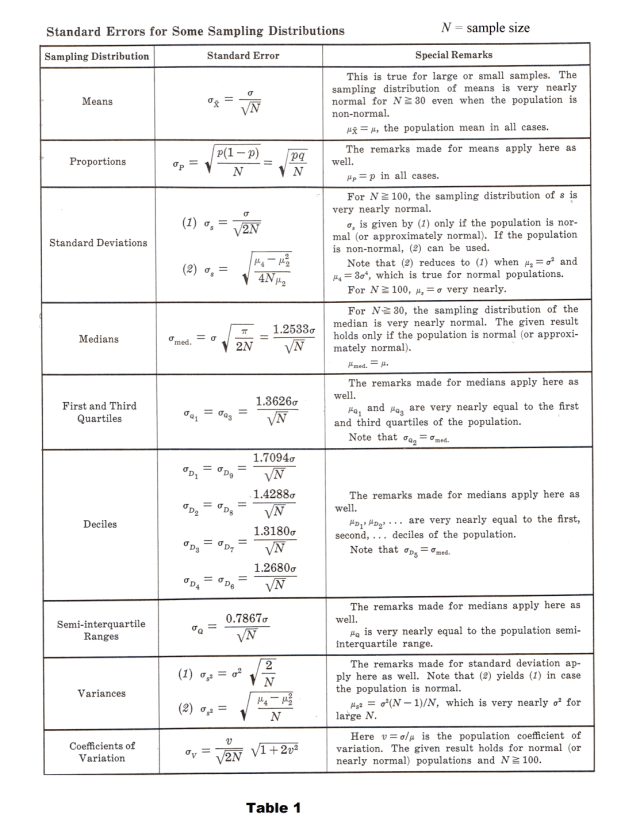
Standard error. The standard deviation of the sampling distribution of a statistic is referred to as the standard error of that quantity.
Thus the sampling distribution of a statistic is the distribution of the statistic for all possible samples of a given sample size from the given population. If, for example the particular statistic used is the sample mean, the distribution is called the sampling distribution of the means or the sampling distribution of the mean. Similarly we could have sampling distributions of standard deviations, variances, medians, proportions, etc.
An important theorem is the following:
Theorem 1. Suppose all possible samples of size ns are drawn without replacement from a
finite population of size np where np > ns. Let us denote the mean and standard deviation of the
sampling distribution of the mean by
![]() and
and
![]() and the population mean and standard
deviation by μp and σp respectively. Then
and the population mean and standard
deviation by μp and σp respectively. Then
If the population is infinite or if sampling is with replacement, the above results reduce to
![]()
For sample sizes of n ≥30 the sample mean μs is a very close approximation to the population mean μp and the sample standard deviation σs is a very close approximation to the population standard deviation σp. In solving problems the population mean μp and standard deviation σp will generally not be known and the computed values of the sample mean μs and standard deviation σs are used.
Biased and unbiased estimators. If the mean of the sampling distribution of a statistic equals the corresponding population parameter, the statistic is called an unbiased estimator of the parameter, otherwise it is called a biased estimator. The corresponding values of such statistics are called unbiased or biased estimates respectively.
Example 1. The mean of the sampling distribution of means
![]() is given by
is given by
![]() where μ is
the population mean. Thus the sample mean
where μ is
the population mean. Thus the sample mean
![]() is an unbiased estimate of the population mean μ.
is an unbiased estimate of the population mean μ.
Example 2. The mean of the sampling distribution of variances
![]() is given by
is given by
![]() where σ2 is the population variance and n is the sample size. Thus the sample variance s2 is a
biased estimate of the population variance σ2. By use of the modified variance
where σ2 is the population variance and n is the sample size. Thus the sample variance s2 is a
biased estimate of the population variance σ2. By use of the modified variance
![]() we
find
we
find
![]() so that
so that
![]() is an unbiased estimate of σ2. However,
is an unbiased estimate of σ2. However,
![]() is a biased estimate of σ.
is a biased estimate of σ.
In the language of expectation we would say that a statistic is unbiased if its expectation equals
the corresponding population parameter. Thus
![]() and
and
![]() are unbiased since
are unbiased since
![]() and
and
![]() .
.
Efficient estimates. If the sampling distribution of two statistics have the same mean (or expectation), the statistic with the smaller variance is called an efficient estimator of the mean while the other statistic is called an inefficient estimator. The corresponding values of the statistics are called efficient or inefficient estimates respectively.
Example. The sampling distribution of the mean and median both have the same mean, namely the population mean. However, the variance of the sampling distribution of means is smaller than for the sampling distribution of medians. See Table 1. Hence the sample mean gives an efficient estimate of the population mean, while the sample median gives an inefficient estimate of it.
Of all statistics estimating the population mean, the sample mean provides the best or most efficient estimate.
Point estimates and interval estimates. Reliability. An estimate of a population parameter given by a single number is called a point estimate of the parameter. An estimate of a population parameter given by two numbers between which the parameter may be considered to lie is called an interval estimate of the parameter.
Interval estimates indicate the precision or accuracy of an estimate and are therefore preferable to point estimates.
Example. If we say that a distance is measured as 5.28 feet, we are giving a point estimate. If, however, we say that the distance is 5.28 + 0.03 feet, i.e. the distance lies between 5.25 and 5.31 feet, we are giving an interval estimate.
A statement of the error or precision of an estimate is often called its reliability.
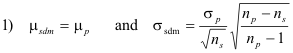
Confidence interval estimates of population parameters. Let μs and σs be the mean and standard deviation (standard error) of the sampling distribution of a statistic S. Then if the sampling distribution of S is approximately normal (which is true for many statistics if the sample size n ≥30) we can expect to find an actual sample statistic S lying in the intervals μs - σs to μs + σs, μs - 2σs to μs + 2σs, or μs - 2σs to μs + 2σs about 68.27%, 94.45%, and 99.73% of the time respectively. Some reflection and examination of Fig. 1 will show that the following statement is also true:
We can expect to find, or we can be confident of finding, μs in the intervals S - σs to S + σs, S -
2σs to S + 2σs, or S - 2σs to S + 2σs about 68.27%, 94.45%, and 99.73% of the time respectively.
Because of this we call these respective intervals the 68.27%, 94.45%, and 99.73% confidence intervals for estimating μs. The end numbers of these intervals (S + σs, S + 2σs, S + 3σs) are then called the 68.27%, 94.45%, and 99.73% confidence limits or, as they are sometimes called, fiducial limits.
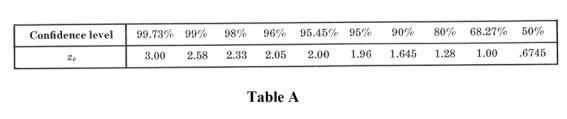
Similarly, S + 1.96 σs, and S + 2.58 σs are 95% and 99% (or .95 and .99) confidence limits for S. The percentage confidence is often called the confidence level. The numbers 1.96, 2.58, etc. in the confidence limits are called confidence coefficients or critical values and are denoted by zc. From confidence levels we can find confidence coefficients and conversely.
In Table A are given values of zc corresponding to various confidence levels used in practice. For confidence levels not presented in the table, the values of zc can be found from the normal curve tables.
Confidence interval estimates for means. If the statistic S is the sample mean
![]() , then
95% and 99% confidence limits for estimation of the population mean μ are given by
, then
95% and 99% confidence limits for estimation of the population mean μ are given by
![]() and
and
![]() respectively. More generally, the confidence limits are given by
respectively. More generally, the confidence limits are given by
![]() where zc, which depends on the level of confidence desired, is read from Table A.
From Theorem 1
above, the
confidence limits
for the
population mean
are given by
where zc, which depends on the level of confidence desired, is read from Table A.
From Theorem 1
above, the
confidence limits
for the
population mean
are given by
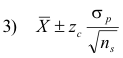
if sampling is from an infinite population or if sampling is with replacement from a finite population (where the sample size is ns) and by
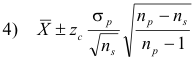
if sampling is without replacement from a population of finite size np.
In general the population standard deviation σp is unknown so we use the sample standard deviation σs which is a very close approximation to the population standard deviation σp provided n ≥30. If ns < 30 the approximation is poor and small sampling theory must be used.
Example. Problem: Measurements of the diameters of a random sample of 200 ball bearings made by a certain machine during one week showed a mean of 0.824 inches and a standard deviation of 0.042 inches. Find the (a) 95% and (b) 99% confidence limits for the mean diameter of all the ball bearings.
Solution.
(a) The 95% confidence limits are
![]()
(b) The 99% confidence limits are
![]()
Note that we have assumed the reported standard deviation to be the modified standard deviation
![]() . If the standard deviation had been s we would have used
. If the standard deviation had been s we would have used
![]() which can be taken an for all practical purposes.
which can be taken an for all practical purposes.
Confidence intervals for proportions. If the statistic S is the proportion of “successes” in a sample of size ns drawn from a binomial population in which p is the proportion of successes (i.e. the probability of success), the confidence limits for p are given by P + zcσp, where P is the proportion of successes in the sample of size ns. The confidence limits for the population proportion are given by
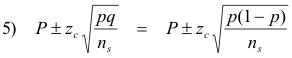
in case sampling is from an infinite population or is with replacement from a finite population, and by
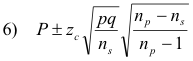
if sampling is without replacement from a population of finite size np. See Table 1.
To compute these confidence limits we can use the sample estimate P for p, which will generally prove satisfactory if ns ≥30.
Confidence intervals for differences and sums. If S1 and S2 are two sample statistics with approximately normal sampling distributions, confidence limits for the differences of the population parameters corresponding to S1 and S2 are given by
![]()
while confidence limits for the sum of the population parameters are
![]()
provided that the samples are independent.
For example, confidence limits for the difference of two population means, in the case where the populations are infinite, are given by
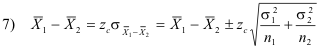
where
![]() , σ1, n1,
, σ1, n1,
![]() , σ2, n2 are the respective means, standard deviations and sizes of the two
samples drawn from the populations.
, σ2, n2 are the respective means, standard deviations and sizes of the two
samples drawn from the populations.
Similarly, confidence limits for the difference of two population proportions, where the populations are infinite, are given by
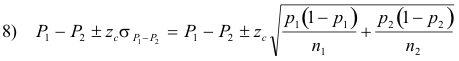
where P1 and P2 are the two sample proportions, n1 and n2 are the sizes of the two samples drawn from the populations, and p1 and p2 are the proportions in the two populations (estimated by P1 and P2).
Confidence intervals for standard deviations. The confidence limits for the standard deviation σ of a normally distributed population as estimated from a sample with standard deviation s, are given by
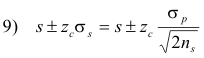
where ns is the sample size, σp is the population standard deviation, and σs is the standard error
for standard deviations. See Table 1. In computing these confidence limits we use the sample
standard deviation (either s or
![]() ) as an estimate for σp .
) as an estimate for σp .
Probable error. The 50% confidence limits of the population parameters corresponding to a statistic S are given by S+0.6745σs. The quantity 0.6745σs is known as the probable error of the estimate.
Much of the above excerpted from Murray R. Spiegel. Statistics. Schaum.
For examples, worked problems, and clarification see Theory and Problems of Statistics by Murray R. Spiegel, Schaum’s Outline Series, Schaum Publishing Co.
References
Murray R Spiegel. Statistics (Schaum Publishing Co.)
Jesus Christ and His Teachings
Way of enlightenment, wisdom, and understanding
America, a corrupt, depraved, shameless country
On integrity and the lack of it
The test of a person's Christianity is what he is
Ninety five percent of the problems that most people have come from personal foolishness
Liberalism, socialism and the modern welfare state
The desire to harm, a motivation for conduct
On Self-sufficient Country Living, Homesteading
Topically Arranged Proverbs, Precepts, Quotations. Common Sayings. Poor Richard's Almanac.
Theory on the Formation of Character
People are like radio tuners --- they pick out and listen to one wavelength and ignore the rest
Cause of Character Traits --- According to Aristotle
We are what we eat --- living under the discipline of a diet
Avoiding problems and trouble in life
Role of habit in formation of character
Personal attributes of the true Christian
What determines a person's character?
Love of God and love of virtue are closely united
Intellectual disparities among people and the power in good habits
Tools of Satan. Tactics and Tricks used by the Devil.
The Natural Way -- The Unnatural Way
Wisdom, Reason and Virtue are closely related
Knowledge is one thing, wisdom is another
My views on Christianity in America
The most important thing in life is understanding
We are all examples --- for good or for bad
Television --- spiritual poison
The Prime Mover that decides "What We Are"
Where do our outlooks, attitudes and values come from?
Sin is serious business. The punishment for it is real. Hell is real.
Self-imposed discipline and regimentation
Achieving happiness in life --- a matter of the right strategies
Self-control, self-restraint, self-discipline basic to so much in life