Website owner: James Miller
Grouped data. Frequency Table. Histogram. Frequency polygon. Relative frequency table. Cumulative frequency table. Frequency curves
Grouped data
Definitions
Raw data. Collected data which has not been organized numerically.

Array. An arrangement of raw numerical data in ascending or descending order of magnitude.
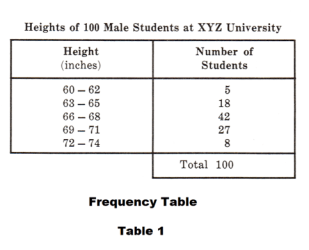
Grouped data. Data organized and summarized in a Frequency Table. See Table 1.
Range of collected data. The difference between the largest and smallest numbers of the collected data. For example, if the collected data consists of the collected heights of 100 university students and the largest height is 74 inches and the smallest height is 60 inches, the range is 74 - 60 = 14 inches.
Class. When summarizing large amounts of raw data it is often useful to divide the data into classes or categories in the form of a Frequency Table. Table 1 is a frequency Table for heights of 100 male students of XYZ University. The classes are 60 - 62, 63 - 65, etc.
Frequency Table. A tabular arrangement of data by classes together with the corresponding class frequencies.
Class interval. A symbol defining a class such as 60 - 62 in Table 1.
Class limits. The end numbers defining a class such as 60 and 62 in Table 1. The smaller number is the lower class limit and the larger number is the upper class limit.
Class boundaries (or true class limits). In Table 1 the class interval 60 - 62 includes all measurements from 59.5000.. to 62.5000.. . The numbers 59.5 and 62.5 are called the class boundaries or true class limits. The smaller number 59.5 is the lower class boundary and the larger number is the upper class boundary.
Class size, width, or length. The size, width, or length of a class is the difference between the lower and upper class boundaries.
Class mark or class midpoint. The midpoint of the class interval. For purposes of mathematical analysis all observations belonging to a given class are assumed to coincide with the class mark. Thus all heights in the class interval 60 - 62 inches are considered as 61 inches.
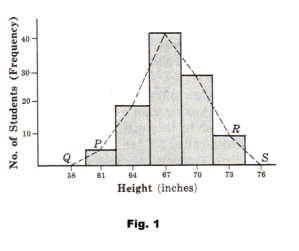
Histogram. A histogram (or frequency histogram) consists of a set of rectangles having:
1. bases on a horizontal axis (the x axis) with centers at the class marks 2. widths equal to the class interval sizes, and 3. areas equal to the class frequencies. See Fig. 1
Note. If the class intervals all have the same size, the heights of the rectangles are proportional to the class frequencies and it is customary to take the heights numerically equal to the class frequencies. If the class intervals do not have equal size, these heights must be adjusted.
Frequency polygon. A frequency polygon is a line graph of class frequency plotted against class mark. It can be obtained by connecting the midpoints of the tops of the rectangles in the histogram.
Relative frequency table
Relative frequency of a class. The frequency of the class divided by the total frequency of all classes, generally expressed as a percentage. Example. The relative frequency of the class 66 - 68 in Table 1 is 42/100 = 42%.
Relative frequency table. The table obtained by replacing the frequencies of a frequency table by relative frequencies.
Graphical representations of relative frequency tables can be obtained from the histogram or frequency polygon by simply changing the vertical scale from frequency to relative frequency, keeping exactly the same diagram. The resulting graphs are called relative frequency histograms or percentage histograms and relative frequency polygons or percentage polygons, respectively.
Other names for Frequency tables and Relative frequency tables. A frequency table is also called a frequency distribution. A relative frequency table is also called a relative frequency distribution or percentage distribution.
Cumulative frequency distributions
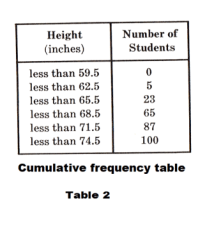
Cumulative frequency. The total of all frequencies up to and including the upper class boundary of a specified class interval. Example. The cumulative frequency up to and including class interval 66 - 68 in Table 1 is 5 + 18 + 42 = 65.
Cumulative frequency table. A table showing cumulative frequencies. A cumulative frequency table for the frequency distribution of Table 1 is shown in Fig. 2.
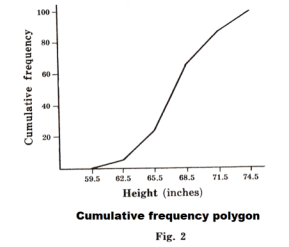
Cumulative frequency polygon (or ogive). A graph showing the cumulative frequencies of a cumulative frequency table. Fig. 2 represents a cumulative frequency polygon of the cumulative frequencies of Table 2.
Relative cumulative frequency (or percentage cumulative frequency). Cumulative frequency divided by the total frequency. For example, the relative cumulative frequency of heights less than 68.5 inches in Table 2 is 65/100 = 65%.
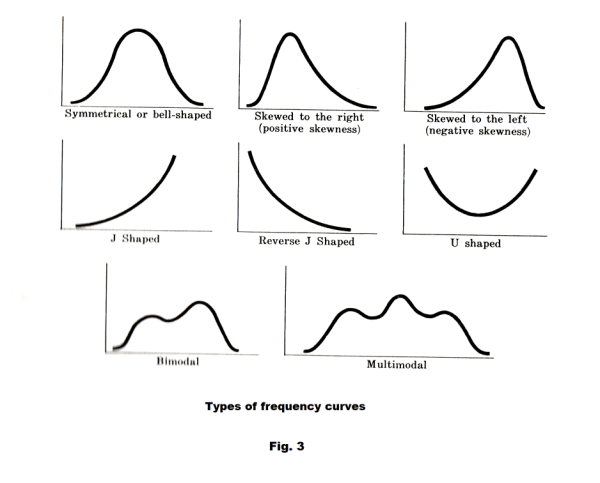
Frequency curves. The usual situation is that one takes a relatively small sample from a large population and the frequency polygon is a broken line segment approximating some curve. However, it would be theoretically possible to take a very large sample, choose class intervals very small, and in this case expect the broken line segment to closely approximate a smooth curve. The frequency curves that arise in practice generally take on certain characteristic shapes. The common types are shown in Fig. 3.
References
Murray R Spiegel. Statistics (Schaum Publishing Co.)
Jesus Christ and His Teachings
Way of enlightenment, wisdom, and understanding
America, a corrupt, depraved, shameless country
On integrity and the lack of it
The test of a person's Christianity is what he is
Ninety five percent of the problems that most people have come from personal foolishness
Liberalism, socialism and the modern welfare state
The desire to harm, a motivation for conduct
On Self-sufficient Country Living, Homesteading
Topically Arranged Proverbs, Precepts, Quotations. Common Sayings. Poor Richard's Almanac.
Theory on the Formation of Character
People are like radio tuners --- they pick out and listen to one wavelength and ignore the rest
Cause of Character Traits --- According to Aristotle
We are what we eat --- living under the discipline of a diet
Avoiding problems and trouble in life
Role of habit in formation of character
Personal attributes of the true Christian
What determines a person's character?
Love of God and love of virtue are closely united
Intellectual disparities among people and the power in good habits
Tools of Satan. Tactics and Tricks used by the Devil.
The Natural Way -- The Unnatural Way
Wisdom, Reason and Virtue are closely related
Knowledge is one thing, wisdom is another
My views on Christianity in America
The most important thing in life is understanding
We are all examples --- for good or for bad
Television --- spiritual poison
The Prime Mover that decides "What We Are"
Where do our outlooks, attitudes and values come from?
Sin is serious business. The punishment for it is real. Hell is real.
Self-imposed discipline and regimentation
Achieving happiness in life --- a matter of the right strategies
Self-control, self-restraint, self-discipline basic to so much in life